
plotly.js
Open-source JavaScript charting library behind Plotly and Dash
JavaScript16211mit
5 months ago
charting-librarychartsd3
plotly.py
The interactive graphing library for Python :sparkles: This project now includes
Python15355mit
6 days ago
d3dashboarddeclarative

dj-plotly-dash
Analytical Django Apps. No JavaScript Required.
JavaScript56mit
2 months ago
chartingdashdata-visualization

Plotly.Blazor
This library packages the well-known charting library plotly.js into a razor com
C#315mit
last month
aspnetaspnetcoreblazor

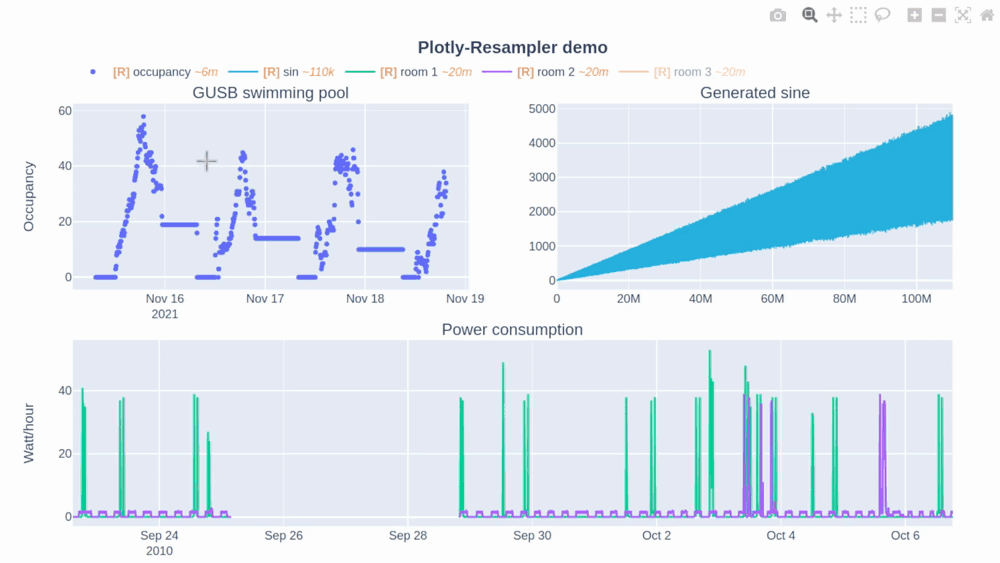
plotly-resampler
Visualize large time series data with plotly.py
Python871mit
5 months ago
data-analysisdata-sciencedata-visualization
dash
Data Apps & Dashboards for Python. No JavaScript Required.
Python19891mit
4 months ago
bioinformaticschartingdash

itermplot
An awesome iTerm2 backend for Matplotlib, so you can plot directly in your termi
Python1480
11 months ago
command-lineiterm2matplotlib
hydrogen
:atom: Run code interactively, inspect data, and plot. All the power of Jupyter
TypeScript3897mit
2 months ago
atomdata-sciencehydrogen

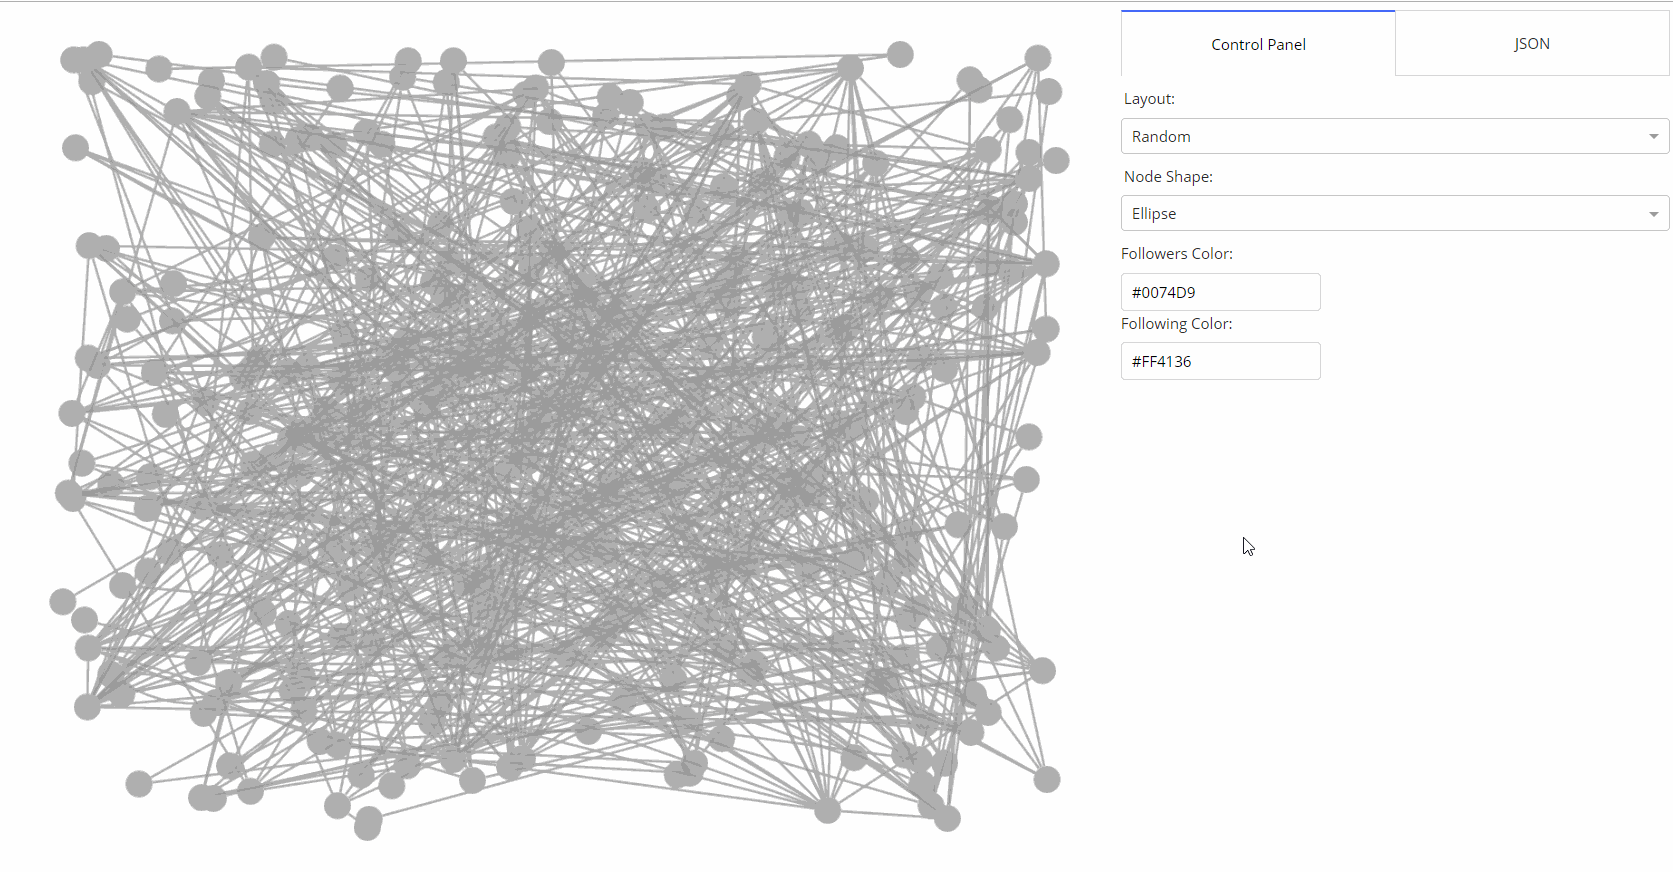
dash-cytoscape
Interactive network visualization in Python and Dash, powered by Cytoscape.js
Python573mit
2 months ago
bioinformaticsbiopythoncomputational-biology
dash-flexbox-grid
Wrapper around react-flexbox-grid for Plotly Dash
Python20mit
2 months ago
css-griddashflexbox-grid
awesome-dash
A curated list of awesome Dash (plotly) resources
Python2009cc0-1.0
3 months ago
awesomeawesome-listplotly

exult
Exult is a project to recreate Ultima 7 for modern operating systems, using the
C++472gpl-2.0
4 hours ago
black-gatec-plus-plus-14forge-of-virtue

plotting-maps
A tool to easily create OpenStreetMap SVG maps to plot them with a pen plotter.
HTML34mit
5 months ago
mapopenstreetmapopenstreetmap-data

dash-mantine-components
Plotly Dash components based on Mantine React Components
TypeScript427mit
7 months ago
dashmantineplotly

svgsort
svg path sorter for more efficient (pen)plotting.
Python247other
9 months ago
artoptimizationpen-plotter

teeplot
organize data visualization output, automatically picking meaningful names based
Python2mit
5 months ago
data-sciencedata-visualizationpython

Graphical
Open-Source, Platform independent module that consumes data points as input and
PowerShell340mit
5 months ago
ascii-artcorelinux

ipyvolume
3d plotting for Python in the Jupyter notebook based on IPython widgets using We
TypeScript1896mit
6 months ago
datavizipython-widgetjupyter
colorcet
A set of useful perceptually uniform colormaps for plotting scientific data
Python665other
2 months ago
bokehcolorcetcolormaps
ggstatsplot
Enhancing {ggplot2} plots with statistical analysis 📊📣
R1894gpl-3.0
2 months ago
bayes-factorsdatasciencedataviz
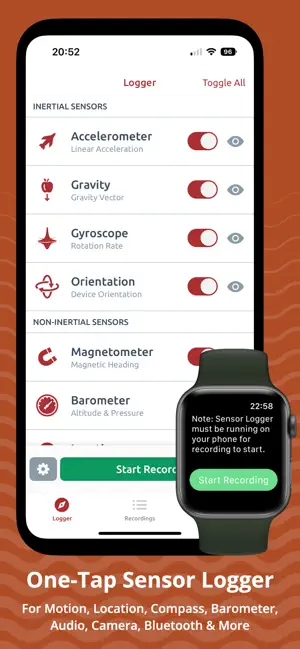
gyroflow
Description One-Tap Sensor Logger in Your Pocket with Watch, Streaming, Bluet
Rust5923gpl-3.0
3 months ago
fpvgoprogpu

hanami
Interactive arts and charts plotting with Clojure(Script) and Vega-lite / Vega.
Clojure364mit
6 months ago
charting-libraryclojureclojurescript

python-ternary
:small_red_triangle: Ternary plotting library for python with matplotlib
Python678mit
8 months ago
pythonternary-plots
plotters
A rust drawing library for high quality data plotting for both WASM and native,
Rust3401mit
3 months ago
data-plottinggraphingplot


pyvista
3D plotting and mesh analysis through a streamlined interface for the Visualizat
Python2383mit
6 days ago
3dhacktoberfestmesh

scikit-plot
An intuitive library to add plotting functionality to scikit-learn objects.
Python2362mit
8 months ago
data-sciencemachine-learningplot
bokeh-notebooks
Interactive Web Plotting with Bokeh in IPython notebook
Jupyter Notebook733bsd-3-clause
7 months ago
bqplot
Plotting library for IPython/Jupyter notebooks
TypeScript3498apache-2.0
7 months ago
ipythonjupytervisualizations
OsmAnd
Description OsmAnd is an offline world map application based on OpenStreetMap
Java4294other
5 hours ago
OsmAnd-iOS
Description OsmAnd is an offline world map application based on OpenStreetMap
Objective-C++232other
2 months ago

dash-core-components
OBSOLETE: now part of https://github.com/plotly/dash
Python271mit
2 years ago
dashplotly-dash
dash-html-components
OBSOLETE - now part of https://github.com/plotly/dash
Python154other
2 years ago
dash
falcon
Free, open-source SQL client for Windows and Mac 🦅
JavaScript5133mit
last year
electronfalconmysql-client


PyCEbox
⬛ Python Individual Conditional Expectation Plot Toolbox
Jupyter Notebook153mit
4 years ago
interpretabilitymachine-learning
gatling-report
Parse Galting simulation.log files to output CSV stats or build HTML reports wit
Java116lgpl-2.1
2 years ago

dash-oil-and-gas-demo
Dash Demo App - New York Oil and Gas
Python184
2 years ago
dashdata-sciencedata-visualization
dash-recipes
A collection of scripts and examples created while answering questions from the
Python1033mit
3 years ago
dashplotly-dash

dash-stock-tickers-demo-app
Dash Demo App - Stock Tickers
CSS129mit
last year
dashdata-sciencedata-visualization
uk-car-accidents
A Plotly Dash App for visualising car accidents in the UK in 2015
Jupyter Notebook9
5 years ago
bigfoot-dash-app
An example application for exploring Bigfoot data with Plotly's Dash.
Python24
last year
dashplotlysasquatch

dash-earthquakes
A Plotly Dash application showing earthquake data from the USGS website
CSS39mit
2 years ago
dashdashboardmapbox
dash-recession-report-demo
Dash demo of the NYTimes "Recession in 255 Charts" report
Python16
last year

dash-svm
Interactive SVM Explorer, using Dash and scikit-learn
Python153mit
4 years ago
dashplotly-dashscikit-learn

VlangBenchmarksVisualization
Plots and statistics for Vlang benchmarks
V8apache-2.0
2 years ago
plotsstatisticsvisualization

Attabench
Microbenchmarking app for Swift with nice log-log plots
Swift1277mit
2 years ago
appbenchmarkmacos

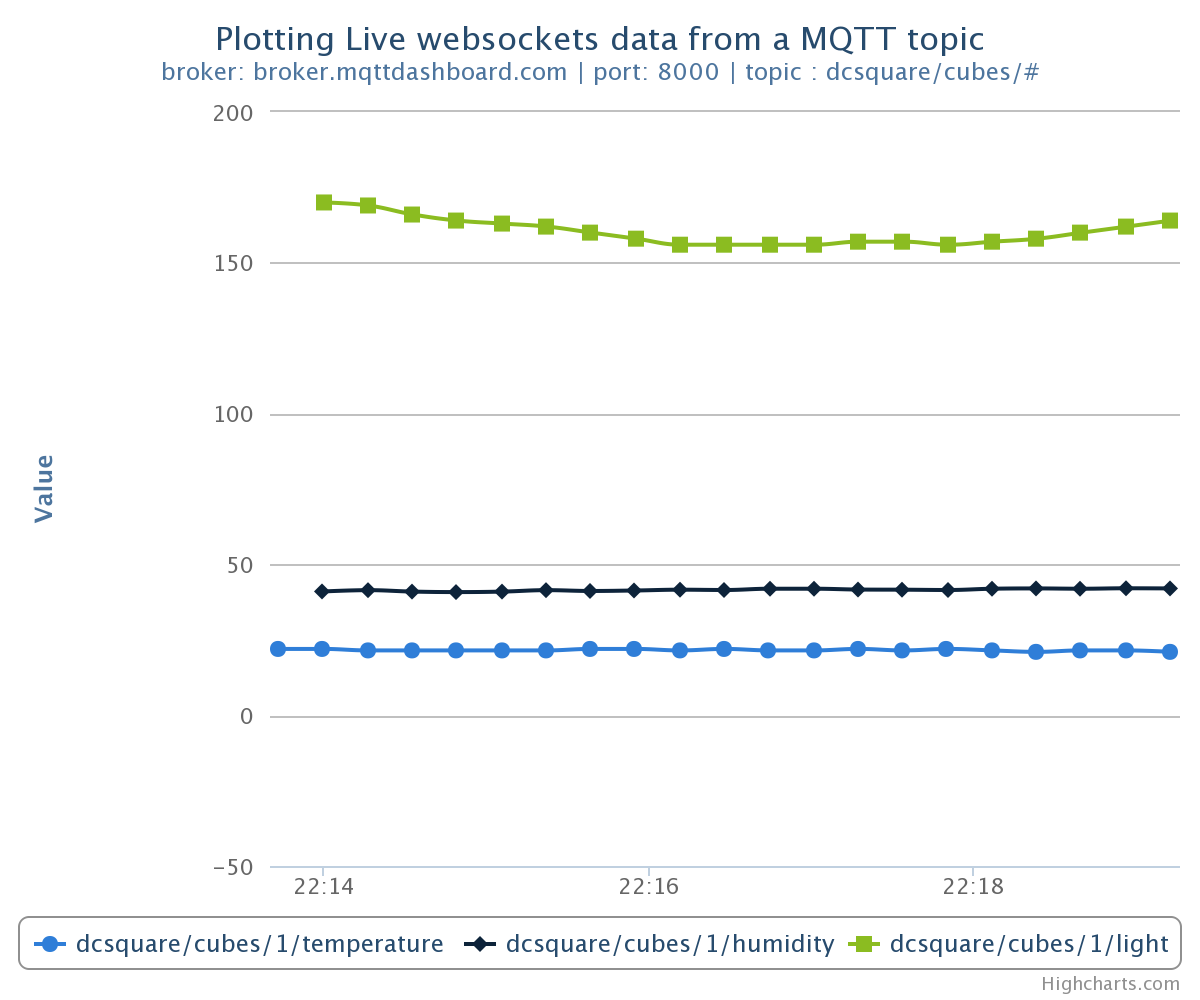
mqtt2highcharts
Simple example of plotting live numbered data from a mqtt/websockets topic using
62mit
8 years ago


animatplot
A python package for animating plots build on matplotlib.
Python405mit
3 years ago
animationdata-visualizationplotting
ishi
Graph plotting package with a small API and sensible defaults powered by gnuplot
Crystal46other
3 years ago
chartcrystalgnuplot

SwiftUICharts
A charts / plotting library for SwiftUI. Works on macOS, iOS, watchOS, and tvOS
Swift702mit
last year
bar-chartchartcharts


pydexter
Simple plotting for Python. Python wrapper for D3xter - render charts in the bro
Python32
6 years ago
kicad-exports
Auto generate exports (schematics, gerbers, plots) for any KiCAD5 project.
HTML74mit
2 years ago
automationexportsgerbers

gcode-generative-for-processing
Simple library for processing to generate gcode for doing pen-plotting with a 3d
Java28mit
4 years ago

sklearn-evaluation
Machine learning model evaluation made easy: plots, tables, HTML reports, experi
2mit
last year

sklearn-evaluation
Machine learning model evaluation made easy: plots, tables, HTML reports, experi
Python344mit
last year
data-sciencedeep-learningjupyter-notebook
filtering-stft-and-laplace-transform
Simple demo of filtering signal with an LPF and plotting its Short-Time Fourier
Jupyter Notebook66mit
6 years ago
butterworthbutterworth-filterbutterworth-filtering
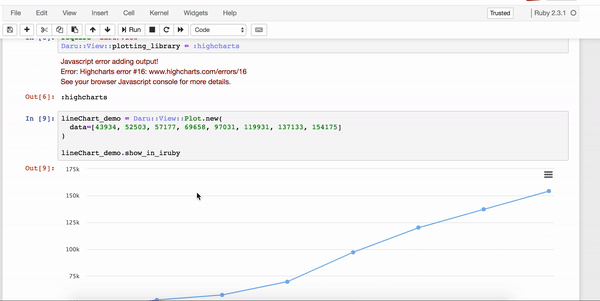
daru-view
daru-view is for easy and interactive plotting in web application & IRuby notebo
Jupyter Notebook87mit
2 years ago
chartsdarudaru-view